'%3e%3crect%20x='0.00'%20y='-0.000000000000057'%20width='240.00'%20height='240.00'%20style='stroke-width:%201.07;%20stroke:%20%23FFFFFF;%20fill:%20%23FFFFFF;'%20/%3e%3c/g%3e%3cdefs%3e%3cclipPath%20id='cpOC4yMnwyMzQuNTJ8NS40OHwyMzEuNzg='%3e%3crect%20x='8.22'%20y='5.48'%20width='226.30'%20height='226.30'%20/%3e%3c/clipPath%3e%3c/defs%3e%3cg%20clip-path='url(%23cpOC4yMnwyMzQuNTJ8NS40OHwyMzEuNzg=)'%3e%3crect%20x='8.22'%20y='5.48'%20width='226.30'%20height='226.30'%20style='stroke-width:%201.07;%20stroke:%20none;%20fill:%20%23FFFFFF;'%20/%3e%3crect%20x='18.51'%20y='187.21'%20width='37.79'%20height='34.29'%20style='stroke-width:%203.20;%20stroke-linecap:%20butt;%20stroke-linejoin:%20miter;%20fill:%20%23FFFFFF;'%20/%3e%3crect%20x='60.49'%20y='135.77'%20width='37.79'%20height='85.72'%20style='stroke-width:%203.20;%20stroke-linecap:%20butt;%20stroke-linejoin:%20miter;%20fill:%20%23FFFFFF;'%20/%3e%3crect%20x='102.48'%20y='152.92'%20width='37.79'%20height='68.58'%20style='stroke-width:%203.20;%20stroke-linecap:%20butt;%20stroke-linejoin:%20miter;%20fill:%20%23FFFFFF;'%20/%3e%3crect%20x='144.46'%20y='101.49'%20width='37.79'%20height='120.01'%20style='stroke-width:%203.20;%20stroke-linecap:%20butt;%20stroke-linejoin:%20miter;%20fill:%20%23FFFFFF;'%20/%3e%3crect%20x='186.45'%20y='50.05'%20width='37.79'%20height='171.44'%20style='stroke-width:%203.20;%20stroke-linecap:%20butt;%20stroke-linejoin:%20miter;%20fill:%20%23FFFFFF;'%20/%3e%3cpolyline%20points='37.40,161.49%2079.38,84.34%20121.37,135.77%20163.36,15.77%20205.34,32.91%20'%20style='stroke-width:%203.73;%20stroke-linecap:%20butt;'%20/%3e%3ccircle%20cx='37.40'%20cy='161.49'%20r='6.22'%20style='stroke-width:%202.83;%20fill:%20%23FFFFFF;'%20/%3e%3ccircle%20cx='79.38'%20cy='84.34'%20r='6.22'%20style='stroke-width:%202.83;%20fill:%20%23FFFFFF;'%20/%3e%3ccircle%20cx='121.37'%20cy='135.77'%20r='6.22'%20style='stroke-width:%202.83;%20fill:%20%23FFFFFF;'%20/%3e%3ccircle%20cx='163.36'%20cy='15.77'%20r='6.22'%20style='stroke-width:%202.83;%20fill:%20%23FFFFFF;'%20/%3e%3ccircle%20cx='205.34'%20cy='32.91'%20r='6.22'%20style='stroke-width:%202.83;%20fill:%20%23FFFFFF;'%20/%3e%3c/g%3e%3cg%20clip-path='url(%23cpMC4wMHwyNDAuMDB8MC4wMHwyNDAuMDA=)'%3e%3cpolyline%20points='8.22,231.78%208.22,5.48%20'%20style='stroke-width:%203.20;%20stroke-linecap:%20square;'%20/%3e%3cpolyline%20points='8.22,231.78%20234.52,231.78%20'%20style='stroke-width:%203.20;%20stroke-linecap:%20square;'%20/%3e%3c/g%3e%3c/svg%3e)
Intro to R and Graphing with the fxl Package
Published: May 25, 2024

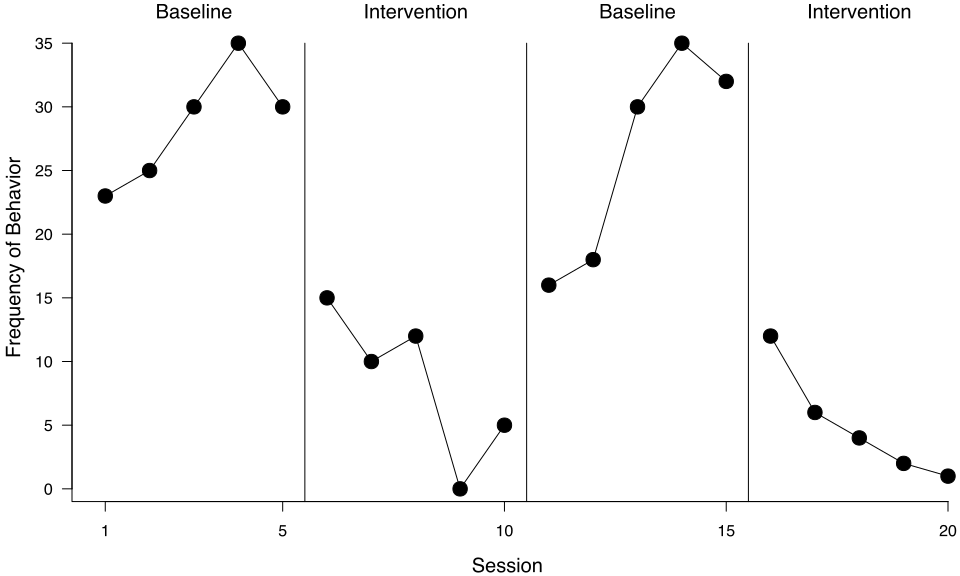
This post provides some introductory content to R, with information and tips for using R for building single-case design figures. Specifically, some basic instructions and practices are provided for working with variables, functions, data types, data structures, and some common programming conventions. It is recommended to review this content to understand the types of syntax used to design figures with the fxl R package.
Programming
Data Types
Data Structures